Role of Data visualizations and user control over health data in fostering user' trust in health information delivered by health chatbots.
HCI RESEARCH / 2024 - 2025
Healthcare AI Chatbot for caregivers.
01: early results
Visualizations enhance engagement and usability but are less influential on trust.
User control, transparency, and data source verification are critical for establishing trust in health chatbots.
Simplifying visualizations and providing interactive elements can improve clarity and user satisfaction.
Read the full paper here.
Many users hesitate to trust chatbots for medical advice. This project explores whether visualizing health information can increase caregiver trust and acceptance of chatbot recommendations.


TIMELINE
12 months
THE TEAM
UX Designer / UX Researcher (me)
Dr. Hidy Kong
Nursing Faculty (University of Washington)
4 Developers
MY ROLE
Conducted end-to-end research to understand user trust and acceptance of healthcare chatbots.
Performed an extensive literature review to identify existing gaps and inform the research direction.
Developed a hypothesis focused on increasing trust and improving acceptance of chatbot-delivered medical advice.
Investigated reasons behind users’ reluctance to use chatbots for medical conditions.
Recruited participants and conducted mock interviews to gather qualitative insights.
Designed and executed user testing to evaluate the proposed hypothesis.
Compiled findings and submitted a comprehensive report as part of my capstone project.
PROJECT OVERVIEW
This project explores whether visualizations of health information can build trust in chatbots for delivering medical recommendations. By comparing visual vs text-only representations, I aim to identify which approach fosters more confidence. This study addresses the trust gap in healthcare chatbots.
STAKEHOLDERS
Nurses, Caregivers of people with chronic medical condition.
TOOLS
Figma/FigJam, Miro, Qualtrics, Google docs and Excel, Zoom.

context.
Healthcare chatbots are increasingly used to support caregivers with medical information, emotional guidance, and daily decision-making. Despite their potential, many users hesitate to trust chatbot-delivered health recommendations, especially when advice feels opaque, automated, or difficult to verify.
This hesitation is amplified in caregiving contexts, where decisions often carry emotional weight and real-world consequences. Trust in these systems is shaped not only by accuracy, but by how information is presented, explained, and controlled. When health data feels unclear or imposed, users disengage, even if the underlying recommendations are sound.
COCO explores this trust gap by examining how visualized health data and user control over personal information influence caregiver trust, usability, and willingness to engage with AI-powered health chatbots.
COCO is a healthcare chatbot designed to support caregivers by providing personalized health insights based on user input and data from wearable devices such as Fitbit. The system uses conversational responses alongside optional visualizations to communicate health information. COCO served as a controlled research environment to examine how different forms of information presentation and user control influence trust in chatbot-delivered health recommendations.
about the app.


Trust in healthcare chatbots is often discussed, but rarely broken down into the specific design factors that influence it. This research focuses on two core dimensions that frequently appear in trust-related literature but are underexplored in applied healthcare chatbot contexts: information presentation and user control.
The study was guided by the following research questions:
RQ1: How does the presence of visualized health information in a healthcare chatbot affect caregivers’ trust in the information provided?
RQ2: How does user control over personal health data and its visualization influence caregivers’ trust and willingness to engage with a healthcare chatbot?
Together, these questions aim to understand whether trust is primarily shaped by how information is shown or by how much agency users have over their data, particularly in emotionally sensitive caregiving contexts.
questions.
method.
This study used a mixed-methods research approach to examine how visualized health information and user control influence caregiver trust in healthcare chatbots. A combination of qualitative insights and evaluative testing was used to capture both perception and behavior.
Participants were caregivers supporting individuals with chronic health conditions. This group was selected due to their frequent interaction with health information systems and the emotional and practical weight of their decision-making.
A pilot study was conducted to validate the study setup, followed by usability testing sessions with caregivers to observe interaction patterns, trust perceptions, and decision-making behaviors.
Participants interacted with a prototype healthcare chatbot under different conditions designed to isolate trust-related factors:
Text-only condition: Health recommendations presented purely as conversational text
Visualization condition: Health information accompanied by visual representations
User control condition: Participants were given transparency and control over how personal health data was visualized and shared
These conditions allowed for comparison between information presentation and user agency as trust-building mechanisms.


(a) Home Screen displaying the daily check-in tool, allowing participants to interact with the chatbot and report their symptoms. (b) Chat Screen illustrating the conversation between the participant and the chatbot, where the user reports their symptoms and discusses their day. (c) A Progress Page showing the user’s health progress over time, providing either a text-based or visual representation of well-being.
The research process included:
Literature review of trust, transparency, and explainability in healthcare AI
Pilot testing to refine study flow and task clarity
Usability testing sessions with caregivers
Post-task questionnaires and structured discussions to assess trust, clarity, and willingness to use the system
Qualitative data analysis to identify recurring themes, concerns, and trust signals
Figma / FigJam: Prototyping and experimental stimuli
Miro: Affinity mapping and synthesis
Zoom: Remote usability sessions
Qualtrics: Questionnaires and rating scales
Google Docs & Excel: Transcription, Data cleaning, pattern analysis, and reporting
artifacts (research framing).
To investigate how trust is shaped in healthcare chatbots, I created a set of controlled research artifacts that allowed caregivers to experience different ways health information could be presented and managed.
These artifacts were not intended as final product designs. Instead, they functioned as experimental stimuli, enabling comparison across conditions while keeping the underlying medical recommendations consistent.
chatbot prototype
A high-fidelity chatbot prototype was developed to simulate a healthcare assistant supporting caregivers with personalized recommendations.
The conversational flow remained constant across conditions to ensure that differences in trust could be attributed to presentation and control, rather than content changes.


visualization conditions.
Health information was presented in multiple formats to test its effect on trust and usability:
1. Text-only responses: Recommendations delivered purely through conversational text
2. Visualized responses: Health data accompanied by charts and visual summaries designed to support interpretation and progress tracking
Visualizations included both simple (line and bar graphs) and complex (heatmaps, symptom–solution graphs) representations, allowing observation of how visual complexity influenced comprehension and trust.
user control mechanisms.
To examine the role of agency and transparency, the prototype included interaction patterns that allowed users to:
1. View where health data originated
2. Control what personal data was shared (e.g., wearable data)
3. Adjust or explore visualizations to better understand trends
These controls were intentionally surfaced to test whether transparency and consent functioned as trust signals within the chatbot experience.


(a) Permission Screen displaying the app’s request for consent to access health data from external devices, like a Fitbit, to proceed with the study’s data-sharing process. (b) Text Summary Screen showing health information presented in a textual format, providing participants with a detailed analysis based on their self-reported data and device data. (c) Visual Representation Screen illustrating the same health information as the text screen but presented through visualizations, allowing users to interpret the data in a graphical format.
findings.
The study revealed a clear distinction between usability and engagement versus trust. While visualizations improved comprehension and willingness to use the chatbot, trust was influenced more strongly by transparency, control, and data source clarity than by visuals alone.
finding 1 - visualizations increased engagement and willingness to use
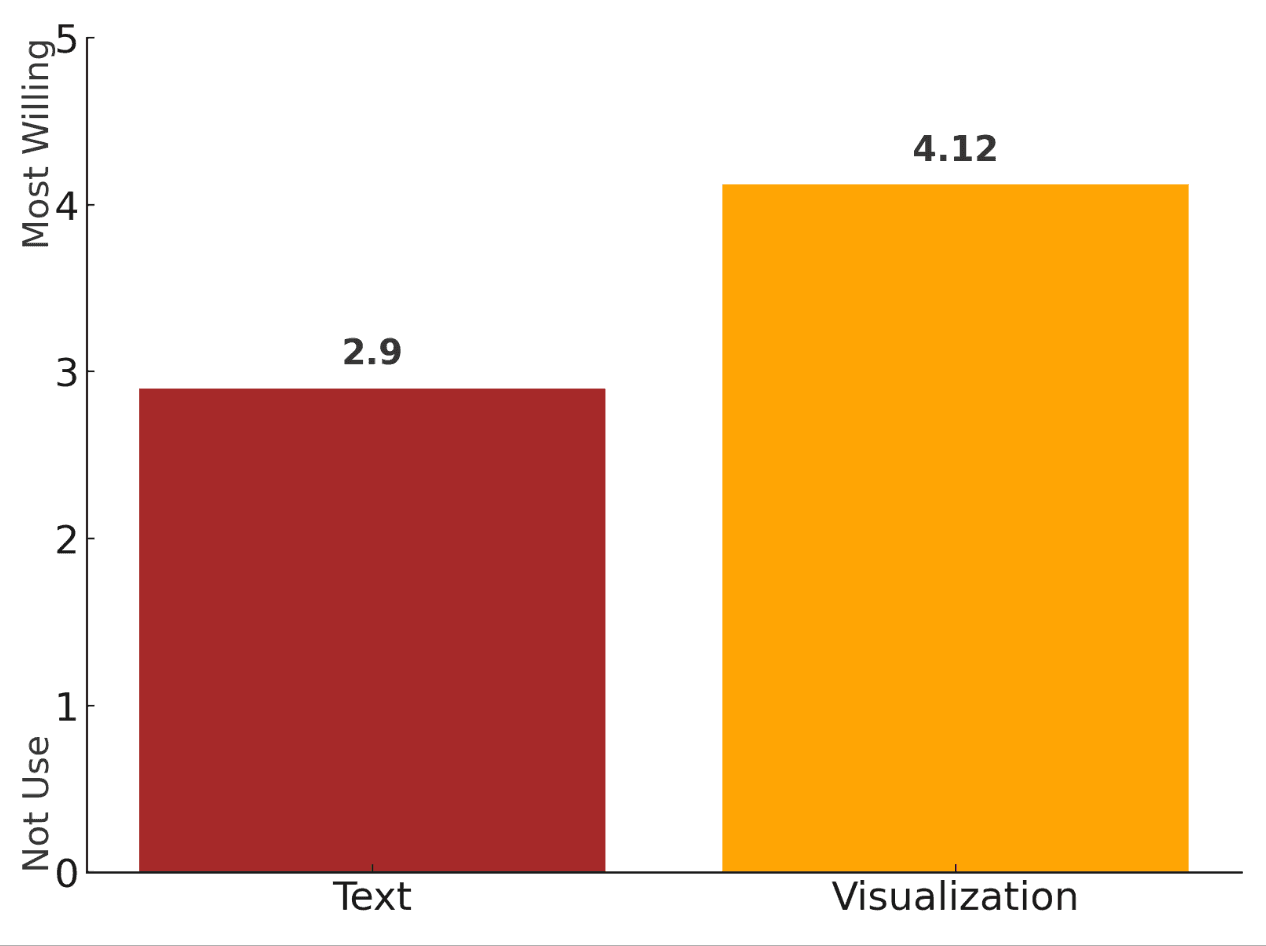
Participants showed a significantly higher willingness to engage with COCO when health information was presented with visual support.
Willingness to use COCO was higher with visualized information (mean = 4.12) compared to text-only responses (mean = 2.9)
Participants described visualizations as more engaging, easier to interpret, and helpful for tracking progress over time
Text-only responses were often perceived as dense, cluttered, and mentally demanding
Interpretation: Visualizations functioned as usability enhancers, reducing cognitive load and improving perceived clarity, which increased engagement with the system.

finding 2 - visualizations alone had limited impact on trust
Although trust ratings were slightly higher in visualization-based conditions (mean = 3.81) than in text-only conditions (mean = 3.3), the difference was not statistically significant.
Participants expressed that:
Visuals made information easier to understand
But visuals alone did not guarantee credibility or trust
Several participants noted that “clear visuals don’t necessarily mean accurate information.”
Interpretation:
Trust in healthcare chatbots is not driven by presentation quality alone. Visual clarity supports comprehension, but credibility requires additional signals.


finding 3 - simpler visualizations performed better than complex ones
Not all visualizations were equally effective.
Simple visualizations (line graphs, bar charts) were consistently preferred
Complex visualizations (heatmaps, symptom–solution graphs) introduced confusion
Non-standard axis labeling
Color overload
Lack of interactivity
Participants reported difficulty interpreting complex visuals without explanation or control.
Interpretation:
In healthcare contexts, simplicity outperforms expressiveness. Overly dense visualizations can undermine clarity and reduce confidence.


(a) defining relationship between the text codes (b) defining relationship between the visualization codes.
finding 4 - user control was a strong trust signal
User control emerged as one of the most influential factors in establishing trust.
Most participants (7 out of 8) were willing to share data from wearable devices if it improved accuracy
Participants emphasized the importance of:
Explicit consent
Granular data-sharing controls
Transparency around data sources and usage
Participants consistently reported feeling more comfortable and confident when they could:
See where data came from
Decide what was shared
Understand how recommendations were generated
Interpretation:
Trust increased when users felt agency and visibility, not when systems appeared more intelligent or automated.
implications.
trust and usability must Be designed separately
The findings show that usability and trust, while related, are not interchangeable. Visualizations improved clarity and engagement, but did not automatically translate into higher trust.
Implication: Design teams should avoid assuming that clearer or more engaging interfaces inherently build trust. Trust requires its own design strategies, particularly in healthcare contexts where credibility, accountability, and transparency matter as much as ease of use.
user control is a stronger trust signal than automation
Participants consistently associated trust with having control over their data rather than with the system’s perceived intelligence or sophistication.
Implication: Healthcare chatbots should prioritize explicit consent, granular data controls, and visibility into data usage. Systems that feel collaborative, rather than authoritative, are more likely to earn user trust.
simplicity is critical in high-stakes contexts
Complex visualizations introduced confusion and reduced confidence, even when users found them visually engaging.
Implication: In healthcare settings, simplicity should take precedence over expressive or dense visual representations. Clear, familiar visual formats paired with explanatory context are more effective than complex or novel visualizations.
transparency builds confidence, not just explanation
Participants placed high value on understanding where information came from and why recommendations were generated.
Implication: Trust-oriented systems should surface data sources, assumptions, and limitations clearly. Transparency should be treated as a core UX requirement, not an optional feature layered on after functionality is complete.
designing for trust requires ongoing evaluation
Trust is not a static outcome; it evolves as users interact with systems over time.
Implication: Healthcare AI tools should be continuously evaluated through user research, especially as models, data sources, and interaction patterns change. Trust should be monitored and refined just like usability or performance.

Miro Link: You can find the coding and data analysis here.
This study reinforced that trust in healthcare technology is complex, contextual, and deeply human. While visualizations improved clarity and engagement, they were not sufficient on their own to establish trust. Trust emerged through a combination of agency, transparency, and clear communication, highlighting the importance of designing beyond surface-level usability.
reflections.
limitations.
The study was conducted with a small group of caregivers, which limits the generalizability of the findings. Additionally, the prototype environment simulated real-world interactions but could not fully capture long-term trust development or real clinical decision-making scenarios.
Visual literacy also varied across participants, influencing how different visualizations were interpreted. This suggests that trust-related design decisions must account for users’ familiarity with data representations and health information.
Future research could examine:
How trust evolves over time with repeated chatbot interactions
The role of explainability in AI-driven health recommendations
Differences in trust perception across caregiver demographics and health conditions
How adaptive visualizations could respond to users’ confidence and literacy levels
Longitudinal studies and real-world deployments would provide deeper insight into how trust is built, maintained, or lost in healthcare AI systems.
future exploration.
TAKEAWAYS
/Ownership
I learned how to design and execute a structured research study, from defining research questions and hypotheses to selecting appropriate methods and balancing qualitative and quantitative data.
/Nuance
I learned that trust is complex and rarely driven by a single factor; visualizations alone are insufficient without transparency, explanation, and user control, especially in high-stakes healthcare contexts.
/Translation
I learned how to turn messy, mixed-method research findings into clear insights and actionable implications that can inform product decisions beyond this specific project.
Airlift me!
Rocket me to the top.